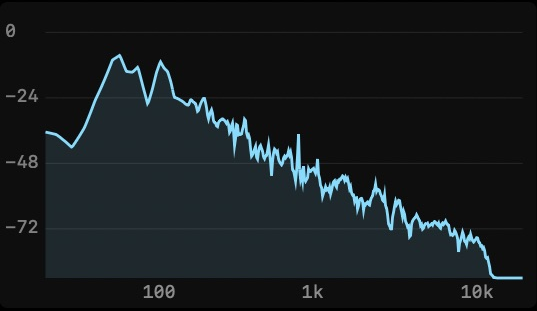
FREQUENCY ANALYSIS
Read the distribution of energy across the audible spectrum. Inspect frequencies and FFT-bin amplitude to investigate tonal balance, resonances and areas that deserve a closer listen.
Studio Meter Pro turns listening into a visual workspace. Read the spectrum, follow the stereo field and arrange the displays around your own way of working.

A first look at the current application. Release details and supported systems will be confirmed at launch.
Read the distribution of energy across the audible spectrum. Inspect frequencies and FFT-bin amplitude to investigate tonal balance, resonances and areas that deserve a closer listen.
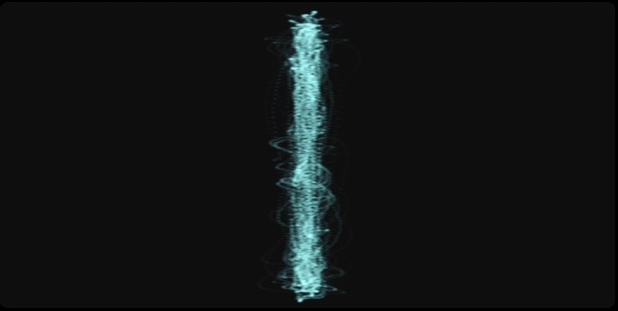
See how the left and right channels occupy the stereo field. Follow the shape and spread of the captured signal as you listen for balance, width and movement.
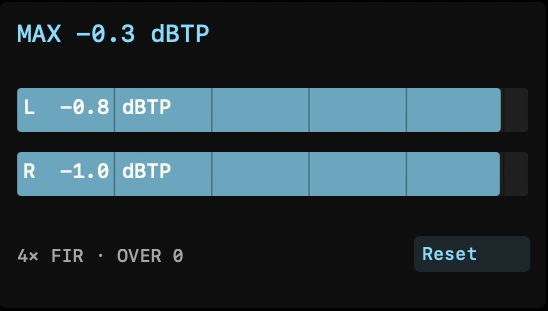
Monitor left and right true-peak estimates and the session maximum in dBTP, using 4× FIR interpolation. The overs counter highlights excursions above 0 dBTP; Reset starts a fresh measurement session.
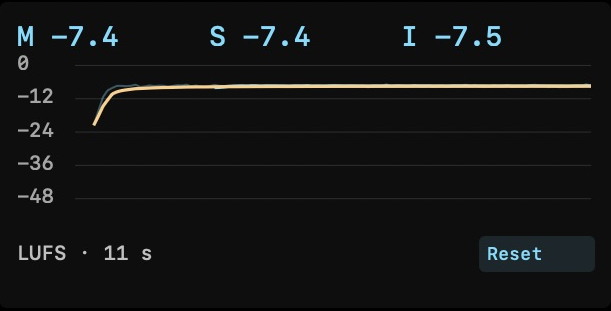
Compare momentary loudness over 400 ms, short-term loudness over 3 seconds and gated integrated loudness. The graph shows up to 120 seconds of recent history, while Integrated follows the full measurement session.
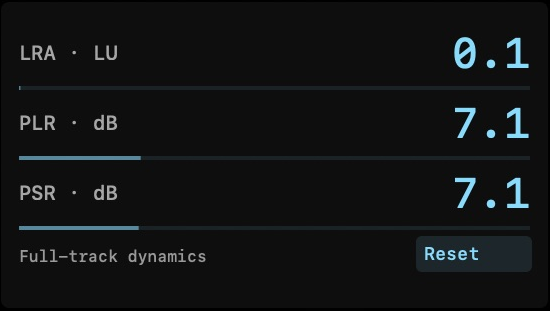
Read Loudness Range, Peak-to-Loudness Ratio and Peak-to-Short-Term Ratio together. These complementary readings help you examine contrast and density; measure the full track to assess the session as a whole.
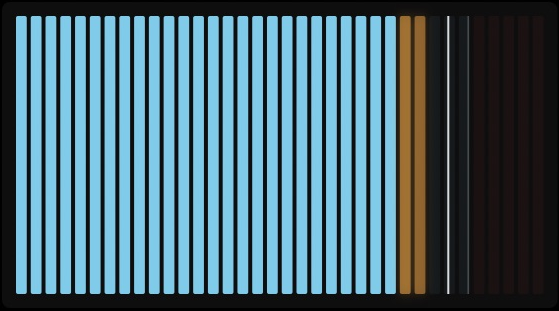
A clear segmented meter follows the captured audio level. Choose the Modern or Classic VU presentation and arrange the display alongside the analysis modules that matter to your session.
Hear when Studio Meter Pro becomes available.